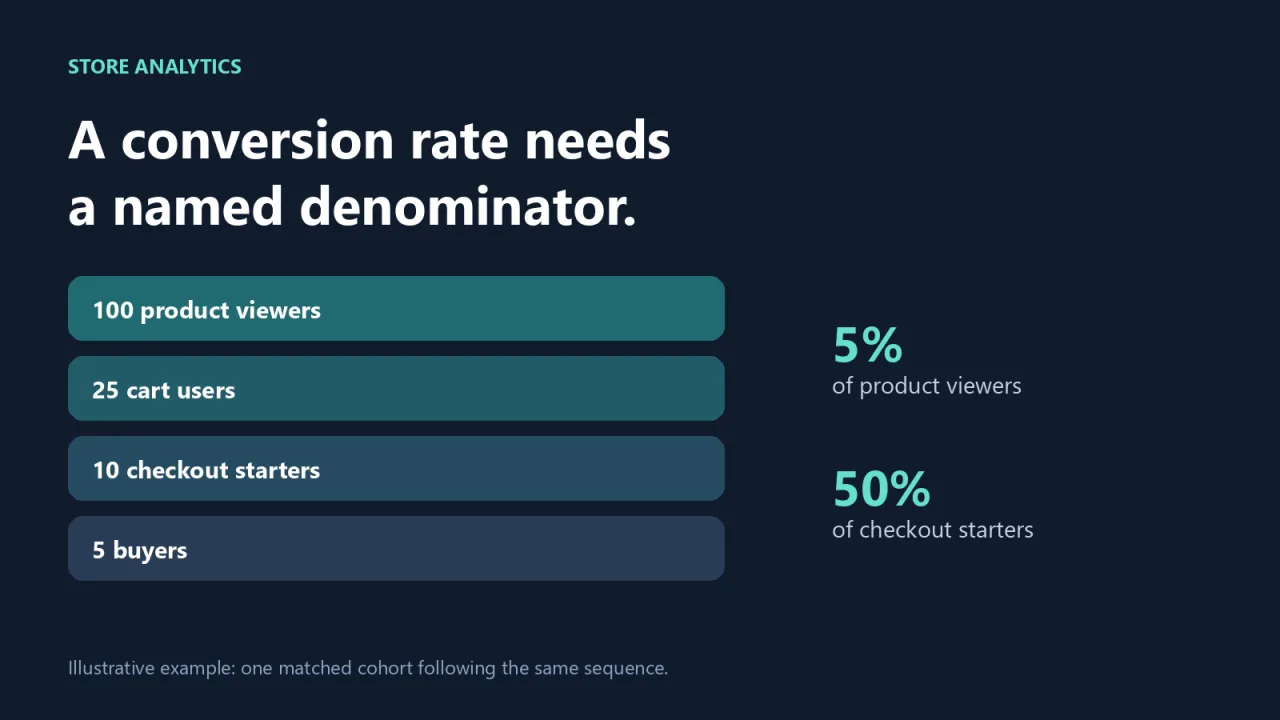
A store report says conversion rose from two percent to three percent. Before celebrating, write down what was divided by what. Purchases divided by sessions, buyers divided by visitors, and completed checkouts divided by checkout starters can all produce a conversion rate. They answer different questions.
For a FiveM store, the confusion grows when the website, payment provider, and game server each describe a different population. A clean funnel begins with a definition that another person can reproduce. The chart comes later, after the arithmetic has earned one.
Name the population and the action
Define a rate in a complete sentence. For example: “Among measured users who viewed a product during the selected period, what proportion later completed a purchase within the specified observation window?” That sentence identifies the people, entry event, outcome, and timing you need to measure.
Choose whether your unit is users, sessions, checkouts, or orders. Keep that unit consistent through the comparison. A buyer may place several orders, and one person may visit several times. Counting all purchases above a denominator of distinct visitors can describe orders per visitor, but it is not automatically the percentage of visitors who bought.
For an illustrative example, suppose 100 measured visitors include five buyers who place eight orders. Buyer conversion is five percent. Orders per visitor is 0.08. Calling the latter eight percent buyer conversion would erase the distinction between purchasing frequency and the number of people purchasing.
Keep both metrics if both help. Give them names that explain the calculation.
Define the events before assembling the funnel
A practical browsing funnel might follow product viewing, adding an item to a cart, starting checkout, and purchasing. Decide what must actually happen for each event to count. A checkout button click is not necessarily evidence that the checkout page loaded successfully.
Google Analytics documents ecommerce events including view_item, add_to_cart, begin_checkout, and purchase. These events require an ecommerce implementation; their existence in the documentation does not mean every storefront sends them automatically. Verify the events and their parameters in your actual setup. Google Analytics ecommerce measurement guide.
Write down any gaps you cannot observe. If the store can measure the checkout handoff but cannot reliably connect that visit to the completed payment, show the handoff rate and separately report confirmed orders. Do not fill the gap by assuming every payment belongs to a tracked starter.
Keep free downloads, paid purchases, and subscription renewals distinguishable where they follow different paths. A renewal may complete without a fresh browsing visit. Adding it to a browse-to-purchase numerator can make the website look more persuasive than the observed journey supports.
Decide where someone may enter
Some visitors arrive at a product page. Others follow a direct link into checkout. If your funnel requires the product view first, the second group may complete purchases without qualifying for that funnel.
Google Analytics distinguishes closed funnels, which require entry at the first step, from open funnels, which allow entry at any step. Its funnel exploration also counts progress according to the defined sequence, so skipping a required step changes where a user is counted. Google Analytics funnel exploration documentation.
Use a closed funnel when the question concerns completion of a particular starting journey. Use an open funnel to examine multiple entry points, while keeping those entrants distinguishable. Neither setting is universally more accurate; each answers a different question.
Record the required order, allowed time between steps, and whether unrelated actions may occur between them. If you change those settings, annotate the change. A rate that rises because the definition became broader is not evidence that the store experience improved.
Keep the numerator inside the denominator
For a conversion proportion, the people or sessions counted as successful should belong to the population that had the opportunity to convert. This is where apparently sensible dashboard combinations go wrong.
Suppose a week has 200 tracked checkout starters and 80 paid orders in the payment system. Dividing 80 by 200 does not establish a forty percent checkout completion rate. Some orders might belong to earlier starters, untracked visitors, repeat purchases, or paths outside the selected funnel.
If you can link 60 successful starters to those same 200 tracked starters within the chosen window, then thirty percent is the observed completion proportion for that defined group. The remaining payment records still matter, but they belong in reconciliation rather than being silently assigned to the measured funnel.
Apply the same discipline when connecting store and game data. All active players are not necessarily store visitors, and all store visitors are not necessarily active players. A server participation metric and a website conversion metric can sit beside each other without pretending they describe the same people.
Check duplicate purchases and missing observations
Reloading a confirmation page or sending the same completion signal twice can distort event counts if the implementation does not handle duplicates correctly. Verify a purchase using a stable order identifier, then check what happens when the completion page is revisited.
For web streams, Google Analytics documents purchase deduplication using transaction IDs. It requires an ID unique to the order, warns against reusing IDs across users, and warns that an empty transaction ID can cause purchases to be deduplicated together. The documentation says this transaction-ID deduplication does not apply to app streams. Google Analytics transaction ID guidance.
Reconcile measured purchase events against your confirmed order records, using consistent status definitions and dates. Investigate discrepancies without assuming that browser analytics should contain every order. Document exclusions such as test purchases and any separate treatment of refunds.
Respect the measurement choices and privacy controls in your implementation. Report the population you can observe. A precise label such as “tracked checkout users” is more honest and more useful than presenting incomplete observation as every customer.
Compare like with like before making a change
Segment only where there is a practical question. New and returning customers, different entry routes, or mobile and desktop visits may experience different journeys. Mixing them can change an overall rate even when each group's behavior stays the same.
Show counts alongside percentages. Two purchases from ten visitors and twenty purchases from one hundred visitors have the same rate, but very different amounts of evidence behind them. Do not treat a small movement over a quiet afternoon as proof that a new layout works.
Keep a short definition beside each report: unit, entry condition, outcome, observation window, exclusions, and measurement source. When reviewing the broader store numbers that can signal trouble, those definitions help separate a real change from a reporting change.
Choose the next action from the specific step that needs investigation. If tracked users reach checkout but completion cannot be reconciled, validate the tracking before rewriting the product page. If a clearly measured step repeatedly loses people, examine that experience with the relevant population. The useful conversion rate is the one whose numerator and denominator you can explain without reaching for the word “roughly.”